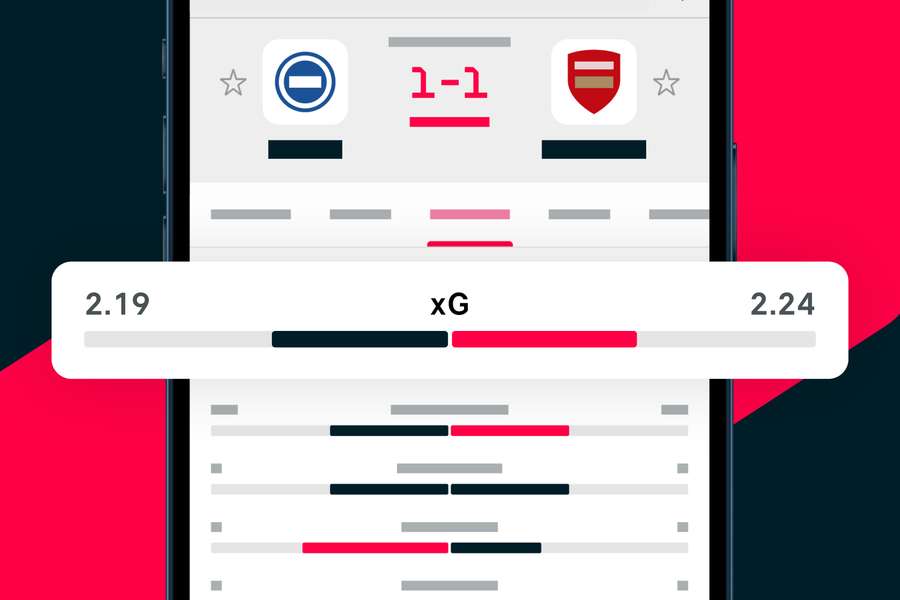
Expected goals or xG: What is it and what can its value be used for?

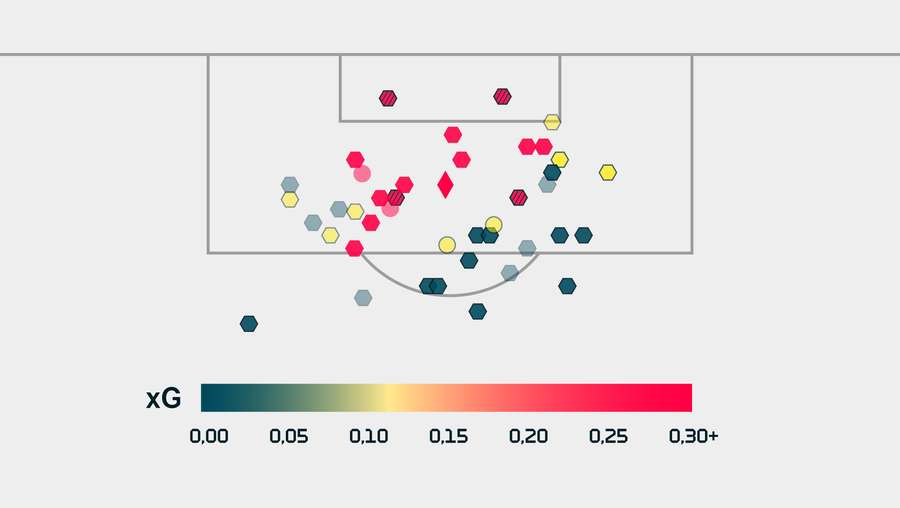
It is simply an abbreviation of the words expected goals. It expresses the numerical probability that a given shot will end up in the net. What is important here is the place on the field the ball is shot from (a shot inside the penalty area always has a higher xG than, for example, a shot from 20 metres out).
An xG model processes thousands of similar shots and assigns them a value between zero (no goal) and one (goal). For example, an attempt with a value of 0.1 xG will find the net only once in 10 attempts. These individual shot values are then added together to make the team's xG for a match.
The popularity of this indicator is growing mainly due to the fact that fans are interested in a much deeper understanding of the game - they want to know as much as possible about it.
The xG value tells them more about the performance of teams, the strength of attacks, defences and even individual players. "It works great, especially when we are trying to predict future events. This is its greatest strength," says Jakub Dobias, founder of the Czech company 11Hacks, which specializes in football data analysis.

As with any analysis, it is necessary to have as much information as possible. In this case, as many matches as possible (i.e. minutes played), from which xG is determined. In other words, the least accurate dataset is from only one match where good or bad luck plays a major role.
"Within a single match, the standard deviation is so large that the values of expected goals and actual goals can be significantly different. So when a team records 3 xG in a match, it means that there is a high probability that they should have scored between 1.47 and 4.53 goals, however counterintuitive that sounds," notes Dobias.
Analytics has been a part of football for decades, although it has only recently become a full-fledged field with the advent of computers. xG itself began to develop at the beginning of the millennium to what it is today, where there are many models that count it. These differ according to the amount and criteria of input information.
They also range in terms of the number of variables taken into account. For example, some models calculate xG only using the previous play and so do not contain enough information. Others work with a much larger amount of information and variables so produce much more accurate numbers.
"We are now developing a unique model because we will also add the influence of time to it. That is, how much time the player used to finish in the given situation. This will give us another indication of the probability that a goal could have been scored," explains Dobias.
As with any other football metric, expected goals cannot always fully reflect reality. xG, for example, is often criticized for taking the average shot into account, so an individual's finishing or goalkeeping skills are not considered.
In addition to simply adding information, xG can also be used, for example, in betting. With its help, extremes can be detected, which could be useful in predicting future results. A team that performs better or worse in the short term than its expected number of goals is likely to soon converge to its average performance.
Keep an eye on xG in Flashscore's match stats next time you're making a prediction.
